Did you know there are more than 450000 eBird Hotspots globally? This page contains everything you need to know about exploring and contributing information to these locations.
Quick Links
- What is an eBird Hotspot?
- Explore Hotspots
- Hotspot Groups
- Iconic Birds
- Frequently Asked Questions about eBird Hotspots
What is an eBird Hotspot?
Hotspots are collaborative birding locations suggested by eBird users. Hotspots allow multiple birders to enter data into the same shared location, creating aggregated results available through eBird's "Explore" tools.
What is the difference between an eBird Hotspot and Personal Location?
eBird Hotspots are communal locations that are visible to everyone, while personal locations are only accessible to a limited number of people.
eBird Hotspots
- On Maps: Indicated by a large pin with a flame icon
- On Checklists: Location names appear as blue links
- Creation: Must be suggested and approved by a volunteer eBird Hotspot Admin
- Management: Can only be moved or renamed by an eBird Hotspot Admin
- Use: Can be used by anyone during the location selection process
Personal Locations
- On Maps: Indicated by a small pin with no icon
- On Checklists: Location names are black, unlinked text
- Creation: Can be created by anyone during the checklist submission process
- Management: Can be moved, merged, and renamed by the location creator
- Use: Can only be used by the location creator and anyone with a shared checklist from that location
For more information about the differences between eBird Hotspots and personal locations, visit: When should I use a Hotspot instead of a personal location?
Explore Hotspots
There are three primary ways to explore eBird Hotspots.
1. On the eBird.org website, open the Explore page and click "Explore Hotspots"
2. Search for any county, state, or country using "Explore Regions" then tap Hotspots from the navigation menu.
3. Explore eBird Hotspots on your mobile device using eBird Mobile Explore.
eBird Hotspots and Regional Explore pages share many of the same features, including species lists, illustrated checklists, recent visits, and Top eBirders. Visit Explore Regions in eBird for additional descriptions of these shared features. Hotspot Groups
eBird Hotspot Groups organize multiple individual hotspots within a shared area.
For example, a state park or wildlife refuge might have several great birding locations—maybe a nature trail, a visitor's center, and a meadow overlook. Instead of treating these as completely separate places, these hotspots can be combined together to form a Hotspot Group under a single location that represents the entire area.

Above: The group overview page has a map of all hotspots in the group.
Each hotspot can only belong to one group at a time, and every Hotspot Group has a "Parent location"—an overview page representing the entire group. You can submit checklists directly to the overview location, but only do this if the area you birded isn't represented by a more precise location.
Content and Features
The group overview's 'About' page describes the area as a whole. An excerpt of that content appears on each individual hotspot page within the group. Use the overview page's content sections for information that applies to the entire area—hours, fees, and stewardship details, for example.
The Features section is unique to each individual hotspot. Features on the group overview should reflect what's
generally true for the entire area. For example, if at least one hotspot in the group has a public restroom, select
'Yes' for Restrooms on the group overview—then select Yes or No on individual hotspots based on whether that
specific site has one. (Learn more about Hotspot Features)

Above: The 'Hotspots' section of the group overview page shows a leaderboard of which hotspots in the group have the most checklists and which ones have the most species reported. At the Port of Brisbane, Swan Lake has the most species observed, but the Shorebird Roost is more frequently visited.
Data Aggregation
Parent locations aggregate data across all hotspots in the group. Statistics for a parent location represent the entire group's combined data, including public checklists submitted to the parent location. The parent hotspot page functions as the group overview, summarizing checklist submissions across all hotspots in the group. Likewise, the leaderboard shows top contributors based on combined activity across all hotspots.
The group overview combines data from all hotspots in the group. Statistics on the group overview page—species totals, checklist counts, and Top 100 standing—represent the entire group's combined data, including public checklists submitted directly to the group overview location..
Pro Tip: Maximize your birding impact! As you explore Hotspot Group, submit separate checklists from each individual hotspot you visit. Your birding activity will automatically roll up to the Parent hotspot to boost the stats for the entire group. It's extra recognition for your birding efforts—you'll get credit for birding both the individual hotspots AND the overall location!Very Large Areas
Some areas are so large that checklists submitted directly to the overview page do not have enough location precision to be useful for scientific analysis, including eBird Status and Trends models.
Yellowstone National Park, for example, covers 13,000 square miles (33,700 sq km) across four states. Reporting birds from "Yellowstone National Park (general area)" isn't precise enough to be used by eBird Status and Trends models.
For areas like this, eBird Mobile won't show the group overview hotspot in Recommended Locations or on the nearby map, guiding you to select a more specific location within the group instead.
Iconic Birds
Iconic Birds on eBird Hotspot pages highlight which species are most special for a given location, relative to the surrounding region (usually the equivalent of a county or a state/province), based on frequency. This helps visitors quickly understand what makes each Hotspot special. If you're looking for a particular species, consider starting with the Hotspots that show it as Iconic.
Iconic Birds can include species that are common and easy to observe at the location, but they also may include species that are extremely rare and don’t occur every year.
Iconic Birds typically fall into three categories:
- Localized species (regular at the Hotspot, uncommon elsewhere in the region) → indicate a hotspot has unique habitat
- Rare vagrants (unpredictable and infrequent, but still meet criteria for inclusion) → indicate a site might be known regular occurrence of certain rarities
- Common species (reported more often at the Hotspot than other sites) → suggest a generally reliable birding place
The Iconic Birds bar charts and frequency values can help to indicate which category applies to a particular species or site.
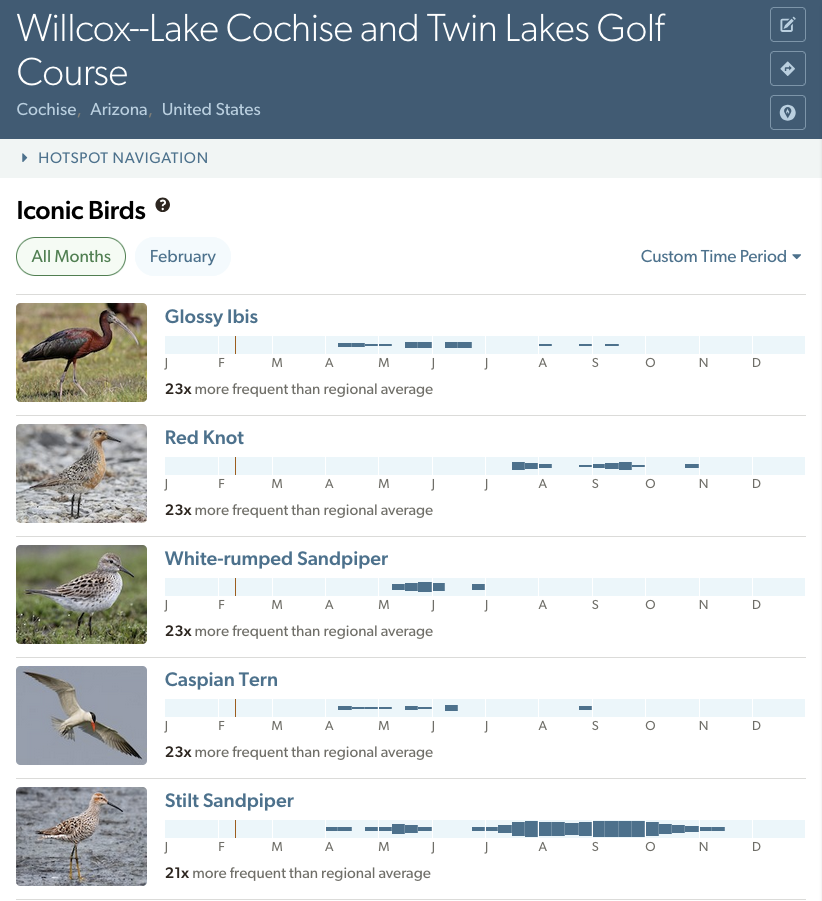
Above: Willcox--Lake Cochise and Twin Lakes Golf Course is an alkaline lake with extensive shoreline and one of the only permanent water bodies in Cochise County, Arizona-US. Most Iconic Birds here are water-associated species, suggesting this is one of the best places to find waterbirds during summer months. Thin bars on the chart and high frequencies indicate that the top Iconic Birds are recurring rarities—species unusual enough to attract crowds and generate many reports, but so rare they haven't been recorded anywhere else in the county.
How are Iconic Birds selected?
Iconic Birds are calculated both for individual months and for all months combined, using complete checklists from the last 10 years only. Iconic birds compare the frequency at the hotspot to the frequency for the parent region.
Parent Region
For Iconic Birds calculations, the parent region (AKA surrounding region) is the finest-scale geopolitical subdivision that encompasses the Hotspot.
For regions in eBird that have counties or their equivalents within each state/province, the parent region is the county.
Where the smallest level of subdivision is the state/province level, that becomes the parent region. For example, Uganda's four administrative regions have no counties, so all Iconic Birds are calculated relative to their administrative region's average frequency (e.g., for Royal Mile the parent region is Western Uganda).
A few regions like Aruba have no further subdivisions. Iconic Birds for these Hotspots use the entire country as the parent region.
Another example: House Bunting has recently colonized Europe from north Africa. One of the best places to see it in Spain is Algeciras--La Bajadilla, where House Bunting is among the top Iconic Birds.
Spain has two levels of subdivision: autonomies (equivalent to states/provinces) and provinces (counties). Iconic Birds are therefore calculated relative to the province level. The parent region for Algeciras--La Bajadilla is the province of Cádiz.
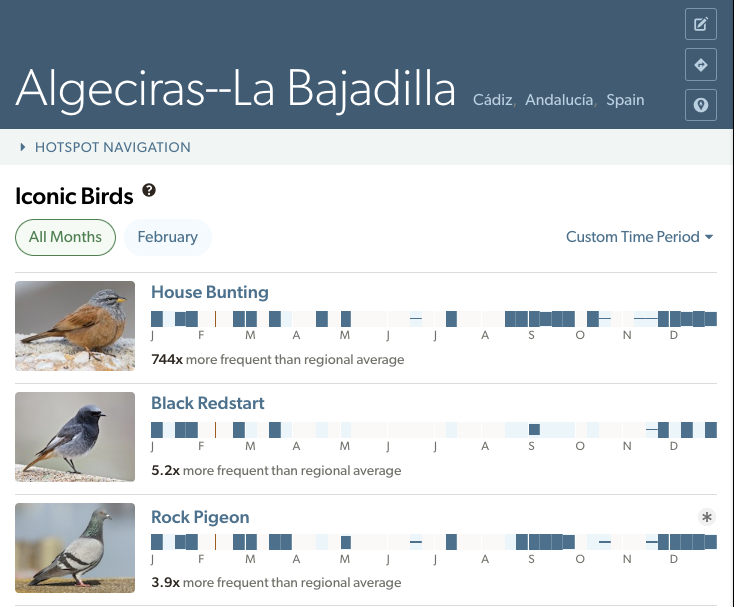
House Bunting is observed 744x more frequently at Algeciras--La Bajadilla than at the average location in Cádiz. It is clearly a specialty for this Hotspot!
Multiple Years
Iconic Birds must be reported in at least 30% of years with available data in the past 10 years. For example, if a Hotspot has:
- Complete checklists from all of the last 10 years, a species must be reported in at least 3 of those years (3/10 = 30%)
- 4 years of data in the past 10 years, a species must be reported in at least 2 years (2/4 = 50%)
- 3 years of data in the past 10 years, a species only has to be reported for 1 year (1/3 = 33%)
- Only 1 year of data in the past 10 years, any species could be Iconic! (1/1 = 100%)
One-time rarities only appear in Iconic Birds if the hotspot has been visited in 3 or fewer of the last 10 years. See low data scenarios below. Frequency
Iconic Species are selected and sorted based on observation frequency. Frequency is calculated by dividing the number of observations of that species on complete checklists by the total number of complete checklists for the selected time period.
That value is compared against the average frequency of that species for the entire parent region. Only species with a Hotspot-specific frequency greater than 1x the average regional frequency are displayed on Iconic Birds and the higher the value, the more the species is unique to that Hotspot.
Lower frequency values mean a species is not particularly unique to the Hotspot and can typically be found at a number of other Hotspots in the region.
How often are Iconic Birds updated?
Iconic Birds are calculated upon creation for each new Hotspot, and then refreshed:
- At least once per year (typically after the annual taxonomy update)
- After significant Hotspot changes (e.g., location moves or merges)
The Iconic Birds section is empty. Why?
You might encounter this message:
“No iconic species yet! Submit complete checklists to reveal what makes this place unique. Select a different time period or location.”
Even if you know there are complete checklists for the selected time period, anything submitted AFTER the most recent Iconic Birds refresh will not appear until the next update.
This message also appears when no complete checklists have been submitted for the chosen month—either because the hotspot is inaccessible during that time or rarely visited at all.
In most of these situations, “All Months” will be more interesting than the individual month data. Tap Iconic Birds from the Hotspot navigation menu to see the full list species from other seasons.
Low data scenarios
Areas with few checklists should be always interpreted with caution. Signs of low data include:
- Extreme frequency scores
- Gaps (gray areas) in the bar charts
- All species have similar bar heights
- 20 or fewer complete checklists for the time period
- Data from only one observer
You should not expect highly accurate Iconic Species information from these locations.
While less reliable, Iconic Birds can still reveal useful emerging patterns. For example, Ulsan--Myeongdeok Lake Park in Ulsan, South Korea has only two checklists for May, but still gives a good idea of some interesting species to keep an eye out for—like Blue-and-white Flycatcher and Dollarbird.
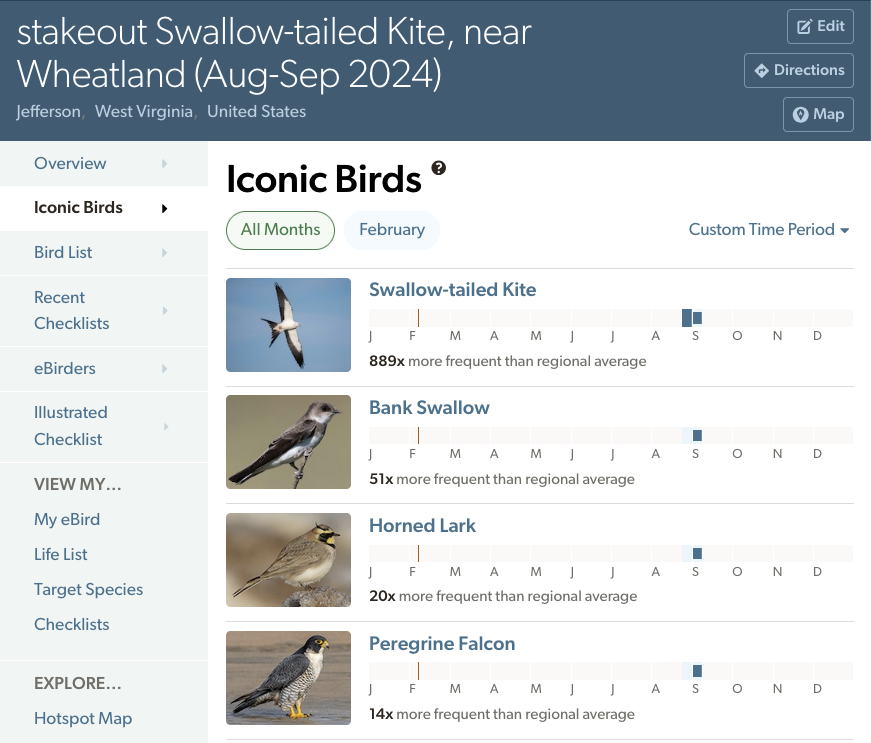
Consider this stakeout hotspot for a Swallow-tailed Kite in West Virginia, US. It shows several low-data indicators: an incomplete bar chart (mostly gray areas; whereas the blue areas, such as for Horned Lark in late August, indicate weeks with complete checklists but no reports of the species) with similar bar heights for all species.
Swallow-tailed Kite is 889x more frequent there than the regional average because it was a first record for the county, and all checklists at that location were submitted during the brief period it was present, with no data from other years.
Given its extreme rarity, Swallow-tailed Kite would likely disappear from the Iconic Birds for this location once three years of data accumulate.
Looking for more? Find additional information about eBird Hotspots at eBird Hotspot FAQs.